
Canterbury & Kent
Location and Property Valuation: Turning a Generic ‘Location’ Search into a Practical UK Surveyor Checklist
Only 11% of buyers who search for a property by “location” can define what that word actually means to their surveyor. The phrase is repeated in every estate agent brochure, yet when it reaches a RICS-registered valuer’s desk, it must be decomposed into a set of measurable, evidence-backed factors that directly influence market value. This article addresses exactly that gap. Location and Property Valuation: Turning a Generic ‘Location’ Search into a Practical UK Surveyor Checklist is the process of converting a vague search term into a structured, defensible framework that surveyors, buyers, and investors can use on any UK property in 2026.
Key Takeaways
- “Location” is not a single factor; it is a hierarchy of measurable variables spanning regional price trends, local authority data, flood risk, transport, schools, noise, and rental yield.
- August 2026 market data shows a sharp north-south divide: northern regions are outperforming, while London and the South East are recording annual price falls, a structural risk that must be captured in every valuation.
- Days on market is a liquidity metric that belongs on every surveyor’s checklist; London currently averages 73 days versus 32 days in Scotland [1][3].
- Environmental and planning factors, flood risk, noise corridors, party wall context, are quantifiable location risks that affect both value and insurability.
- A structured checklist approach produces more defensible valuations and reduces the risk of comparable-selection errors.
Why “Location” Alone Is Not Enough for a UK Valuation
Every RICS Red Book valuation requires the surveyor to justify market value by reference to evidence. When a surveyor writes “good location” in a report without quantification, that phrase is professionally meaningless. The RICS Valuation, Global Standards (Red Book) requires comparable evidence, market analysis, and a reasoned adjustment narrative. “Location” must therefore be broken into discrete, measurable sub-factors.
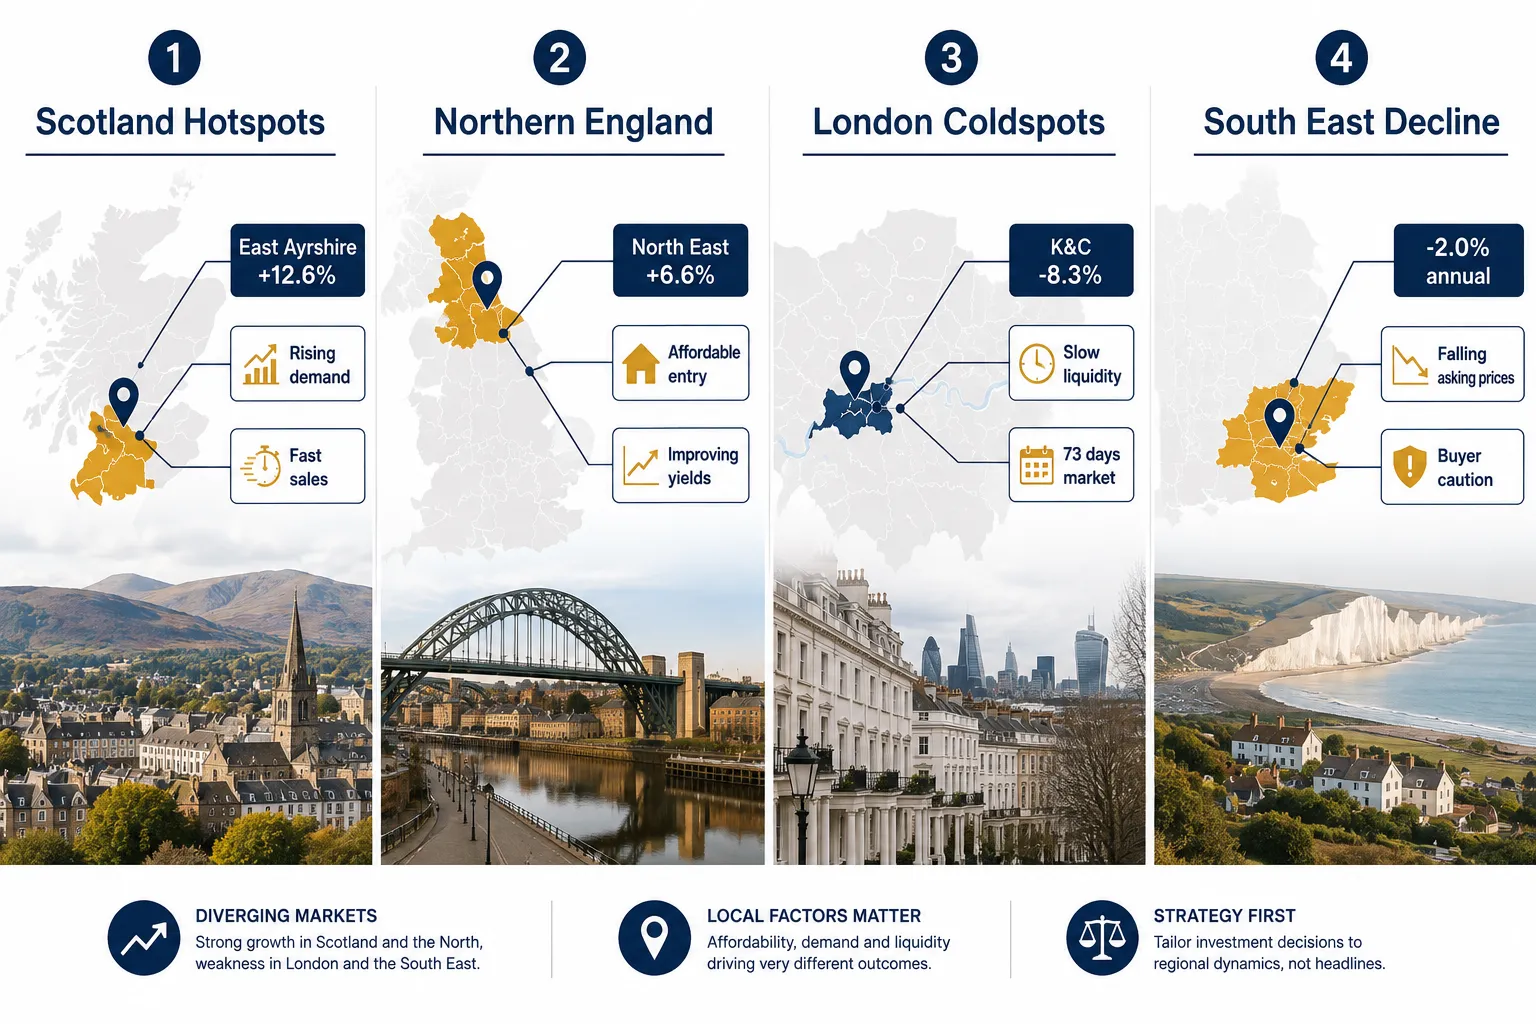
The problem is compounded by the scale of divergence now visible across UK markets. August 2026 Rightmove data shows new seller asking prices in northern England up 1.5% year-on-year, while southern regions are down 1.8% and London is down 3.1% annually [1][3]. A surveyor who treats “the South” as a single location category is working with a blunt instrument. The same applies at the local authority level: Savills’ localised data shows annual growth of 12.6% in East Ayrshire and 10.6% in East Dunbartonshire, set against falls of -8.3% in Kensington and Chelsea and -7.4% in Hastings [14]. These are not minor statistical fluctuations, they represent fundamentally different risk profiles for lenders, buyers, and investors.
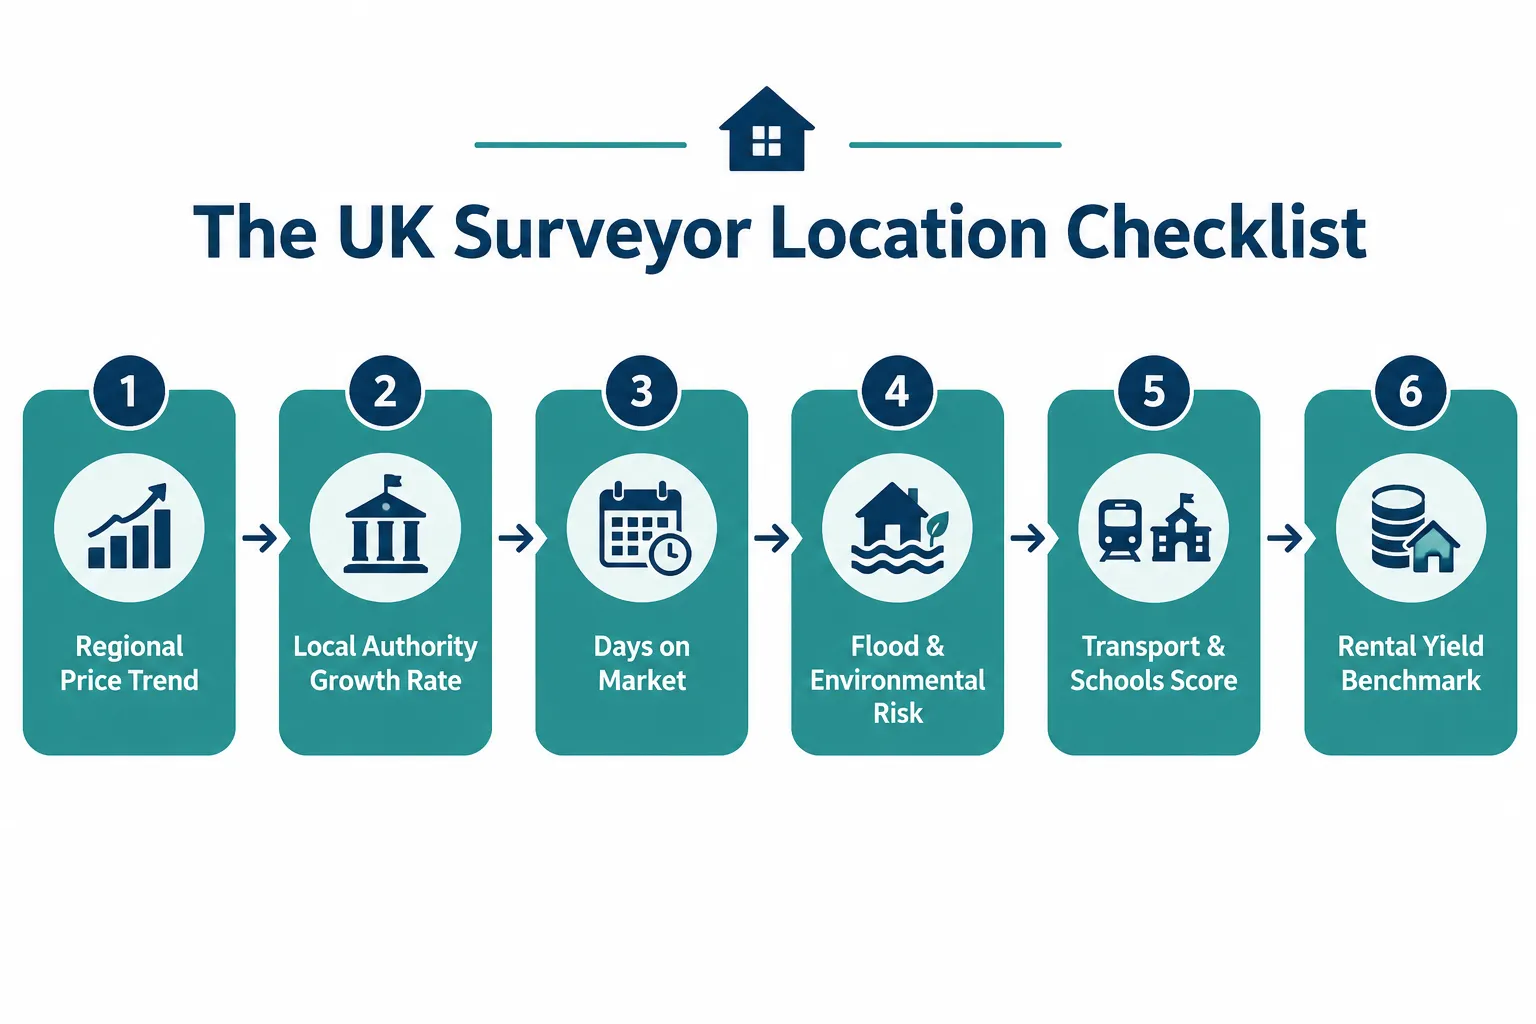
The practical solution is a checklist that forces the surveyor to record each location variable as a separate line item, with a data source and a directional assessment. The sections below build that checklist from the ground up.
The Core Surveyor Checklist: Location and Property Valuation in Practice
Turning a generic “location” search into a practical UK surveyor checklist requires working through five distinct layers: regional market context, micro-location data, environmental risk, amenity factors, and investment metrics. Each layer produces at least one checklist item with a specific data source.
Layer 1: Regional Market Context
Checklist Item 1: Record the current annual price change for the subject region.
This is the foundation. Before any site visit, the surveyor should pull the most recent regional data from at least two indices. August 2026 Zoopla figures show average prices 0.3% lower year-on-year in the South East and 1% lower in London [4], while Nationwide data shows the North East up 6.6% over the year to an average of £163,564 [8]. These two sources do not always agree on magnitude, but they consistently agree on direction, and direction is what matters for risk classification.
“Cross-check regional annual change from at least two indices before finalising any location-driven valuation adjustment.”
Checklist Item 2: Record the monthly price change as a volatility signal.
Month-on-month data has become a meaningful location signal in 2026. London’s average asking price fell 4.4% in a single month in August 2026, compared with -2.1% in the South East and more modest changes in northern regions [1][3]. A steep recent fall is a risk flag when selecting comparables, because older sales may not reflect current achievable prices.
Checklist Item 3: Note the annual cash change in regional average prices.
Percentage changes can obscure the real financial impact. A July 2026 analysis shows Northern Ireland as the strongest performer, with the average home at £197,200 after a £9,610 annual rise, followed by the North West (+£7,100) and Scotland (+£5,220), while London saw an annual fall of £3,270 to £527,100 [10]. Classifying the location as “rising,” “stable,” or “declining” in nominal cash terms is a simple but powerful risk label.
Checklist Item 4: Compare local average prices to national and regional benchmarks.
The affordability gap between locations is now extreme. An August 2026 market note gives an average London price of approximately £533,930 compared with around £182,488 in the North East [10]. The same deposit buys radically different assets depending on location, which affects both loan-to-value ratios and the pool of potential buyers, a direct liquidity consideration. For context on how current market conditions affect specific Canterbury property valuation work, local benchmarks must always be set against these national figures.
Layer 2: Micro-Location and Local Authority Data
Checklist Item 5: Capture the local authority growth rate and direction.
Regional averages mask enormous local variation. The checklist must include a specific local authority field, not a broad regional tick box. Surveyors should classify the local authority as top quartile, mid-range, or bottom quartile based on the most recent available data, and note whether it is a current hotspot or coldspot.
Recent coverage highlights Warrington, Hull, and Dundee as standout local markets with rising sales and faster price growth, while Bath, Oxford, and Harrow show falling sales and flat or negative price growth [12]. Flagging whether the subject property sits within a hotspot or coldspot directly informs the selection of comparables and the adjustment applied for time.
Checklist Item 6: Record typical days to sell in the local authority or region.
Liquidity is a location metric. August 2026 Rightmove data shows an average time on market of 73 days in London versus 32 days in Scotland, with most English regions in the 52-71 day range [1][3]. A property in a slow market carries a liquidity discount that should be explicitly stated in the valuation narrative. This is particularly relevant for valuation reports in Canterbury and other South East markets where liquidity has tightened in 2026.
Checklist Item 7: Classify the region’s north-south divide position.
The structural north-south divide is now a long-term value resilience factor. August 2026 commentary shows Northern Ireland up 7.4% annually, Scotland 3.6%, North East 2.8%, and North West 2.1%, versus Greater London down 1.3% and the South East down 2.0% [10]. The checklist should record whether the region is gaining or losing relative to the national average, with a note on implications for long-term value resilience. More affordable northern regions, North East up 2.7% and North West up 2.6% in asking prices, are outperforming many southern markets [6]. Surveyors should explicitly record whether the subject area is in an “outperforming affordability band” or a high-priced, underperforming band when justifying yield and risk assumptions.
Environmental, Planning, and Amenity Factors in Location-Based Valuations
The second half of the checklist moves from market data to site-specific location factors. These are the variables that a desktop valuation cannot fully capture and that require physical inspection or specialist report review.
Flood Risk
Flood risk is a binary value killer in many locations. The Environment Agency’s Flood Map for Planning divides England into Flood Zones 1, 2, and 3. Zone 3b (functional floodplain) properties face severe restrictions on permitted development and may be uninsurable on standard terms. The surveyor’s checklist item is: “Record the flood zone classification, check the most recent flood history via the Long Term Flood Risk Assessment tool, and note any impact on insurance availability and mortgage eligibility.”
For leasehold properties, flood risk also affects the lease extension valuation calculation, since ground rent and service charge structures may include insurance premiums that are materially higher in flood-risk areas.
Transport Connectivity
Transport access is one of the most consistently evidenced drivers of residential value in UK research. The checklist should record: distance to the nearest rail station (in walking minutes), the service frequency and journey time to the nearest major employment centre, and whether the property falls within a Transport for London zone (for London properties).
The practical adjustment is straightforward: properties within 400 metres of a frequent-service rail station command a measurable premium over otherwise comparable properties further away. This premium should be explicitly stated and supported by local comparable evidence rather than assumed.
School Catchment Areas
School catchment boundaries are a micro-location factor with a well-documented price effect. The checklist item is: “Identify the nearest Ofsted-rated Outstanding primary and secondary school, confirm the property’s catchment status using the local authority’s admission criteria, and note whether catchment status is a likely buyer motivation in this price bracket.”
Catchment effects are most pronounced in the £300,000-£700,000 price bracket, where family buyers dominate. In higher price brackets, private school proximity may be more relevant than state school catchment.
Noise, Air Quality, and Environmental Nuisance
Proximity to major roads, flight paths, railway lines, and industrial uses is a quantifiable location risk. The checklist should record: the road classification of adjacent streets (A-road, motorway), the distance to the nearest flight path (using Civil Aviation Authority noise contour maps for major airports), and any Environmental Health notices or planning conditions relating to noise.
For properties near proposed infrastructure, a factor that has become more prominent given the UK’s 2026 infrastructure surge, party wall act compliance and survey protocols may also be relevant, particularly where data centres or transport links are being developed in proximity to residential stock.
Party Wall Context
The Party Wall etc. Act 1996 creates a location-specific risk for properties in terraced or semi-detached configurations. The surveyor’s checklist item is: “Confirm whether any notifiable works have been carried out under the Act within the last six years, check for any outstanding party wall awards, and note whether the property’s construction type creates elevated party wall risk (e.g., Victorian terrace with shallow foundations).”
Outstanding party wall disputes or awards can affect both value and the speed of a transaction. Surveyors who also act in dispute contexts should be aware of the distinction between their valuation role and their expert witness surveyor role, which carries separate CPR obligations.
Checklist Summary Table
| Location Factor | Data Source | Checklist Action |
|---|---|---|
| Regional annual price change | Rightmove, Zoopla, Nationwide | Record % change and direction; classify as rising/stable/declining |
| Monthly price volatility | Rightmove HPI [1][3] | Flag steep monthly falls as comparable-selection risk |
| Local authority growth rate | Savills localised data | Classify as top/mid/bottom quartile |
| Days on market | Rightmove HPI [1][3] | Record and note liquidity discount if above regional average |
| Flood zone | Environment Agency | Record zone; note insurance and mortgage impact |
| Transport access | TfL / National Rail | Record walk time to station; note premium or discount |
| School catchment | Local authority admissions | Confirm catchment status; note buyer motivation |
| Noise and nuisance | CAA noise maps, OS maps | Record proximity to A-roads, flight paths, industrial uses |
| Party wall status | Land Registry, solicitor | Check for outstanding awards or notifiable works |
| Rental yield benchmark | ONS [9] | Record local average rent and calculate gross yield |
Investment Metrics: Rental Yield and VOA Rating Geography
For investment valuations, the checklist must extend beyond capital value to include rental income and statutory rating context.

Checklist Item 8: Record typical local monthly rent and calculate gross yield.
ONS data for July 2026 reports an average monthly rent of £3,629 in Kensington and Chelsea (the highest in England) versus £554 in Dumfries and Galloway (the lowest) [9]. This is not a marginal difference, it is a 6.5x spread driven entirely by location. The gross yield calculation (annual rent divided by capital value, expressed as a percentage) is a direct output of location, and it should appear as a named line item in any investment valuation.
This is especially relevant for surveyors working on valuation adjustments under 2026’s evolving lettings landscape, where regulatory changes to the private rented sector are affecting achievable rents in some locations more than others.
Checklist Item 9: Identify the VOA regional valuation unit and BA code for non-domestic properties.
For commercial and mixed-use properties, the Valuation Office Agency’s 2026 Rating Cost Guide sets out BA codes and regional valuation units that segment England and Wales into standardised valuation areas [13]. Recording the correct BA code ensures consistency with statutory rating assessments and avoids discrepancies between the surveyor’s opinion of value and the rateable value used for business rates purposes. Surveyors handling commercial building surveys should treat this as a mandatory checklist item for any property with a non-domestic element.
Checklist Item 10: Record whether the subject area is in an outperforming affordability band.
The final investment metric is a relative affordability classification. Regions where average prices remain well below the national average but where price growth is accelerating represent the strongest risk-adjusted investment locations in 2026. Industry summaries from agents and brokers consistently identify the North East and North West as outperforming affordability bands [6]. Surveyors should state explicitly whether the subject location falls into this category, and note the implications for yield compression risk (the risk that rising prices erode rental yields over time).
Conclusion
The phrase “location, location, location” has been repeated so often that it has lost its operational meaning. For UK surveyors and valuers in 2026, the task is to restore that meaning by replacing a vague concept with a structured, evidence-based checklist.
Actionable next steps:
Adopt a two-index minimum rule. Always cross-reference at least two house price indices before recording a regional price trend. Rightmove and Zoopla, supplemented by Nationwide or Halifax lender data, provide a robust triangulation [1][3][4][8].
Add a liquidity field to every report. Record days on market for the local authority alongside the price trend. A property in a 73-day market carries a different risk profile from one in a 32-day market, and that difference should be stated [1][3].
Decompose environmental risk into named sub-factors. Flood zone, noise exposure, and party wall status are not optional extras, they are quantifiable location variables that affect value, insurability, and transaction speed.
Include a rental yield benchmark for all investment-related instructions. ONS rental data is publicly available at local authority level and takes minutes to retrieve. There is no justification for omitting it from an investment valuation [9].
Classify the location’s north-south divide position. In a market where the same percentage change means radically different things in East Ayrshire versus Kensington and Chelsea, a directional classification is a professional obligation, not an optional commentary.
Surveyors who build these ten checklist items into their standard location assessment will produce more defensible reports, select better comparables, and give clients a genuinely useful answer to the question that every property search starts with.
References
[1] House Price Index – rightmove.co.uk [2] Uk Property Market Monthly August 2026 – kensestate.com [3] Rightmove Hpi 17th August 2026 – rightmove.co.uk [4] Zoopla House Price Index – business.zoopla.co.uk [6] Uk House Price Index Update August 2026 – purplebricks.co.uk [8] House Prices Updates – forbes.com [9] August2026 – ons.gov.uk [10] August 2026 Uk Property Market Update Forecasts Cut Rents Wrwye – linkedin.com
Related services from Canterbury Surveyors
- Party wall surveyors in Canterbury & Kent
- Building expert witness surveyors
- RICS property valuations
- Building Surveys (Level 3)
Get a fixed-fee quote or call 0204 579 8270.